Categories Energy

How Recycled Energy Waste from LEDS can Make Horticulture More Efficient

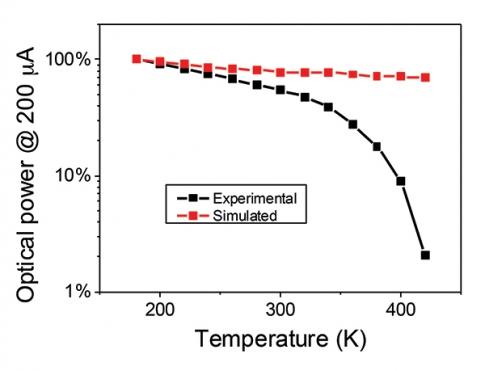
One of the often-cited advantages of LEDs over tungsten filament and fluorescent lights is their high efficiency. A good quality white LED can convert around 40 percent of the electrical energy to light. While this sounds impressive when compared to other light sources it still means 60 percent of the electricity is wasted as heat. Of LEDs that work in the visible spectrum green devices are the least efficient, maxing out at around 20 percent, while UVC LEDs struggle to achieve double figures.

The heat produced by LEDs has to be removed by conduction. Failure to do so gives rise to problems with the quality of light produced and operational lifespan. The conventional solution is to mount the LEDs on a metal PCB and use a suitably large heat sink to dump the heat to the atmosphere.

Greener LEDs, Greener Flora
A new and rapidly increasing opportunity for LED lighting is in horticulture. While we all know that plants need light to grow (with the possible exception of mushrooms), scientists are just beginning to understand how to tune the light spectrum through a plant’s lifecycle to alter factors such as growth rate, crop yield, color and even taste. Some scientists have even predicted LED lights used in this manner will trigger a revolution in horticulture. Perversely, one of the few wavelengths plants do not respond strongly to is green, so the poorer efficiency of 560 nm LEDs is not an issue in this application.

Installing banks of LEDs in greenhouses and sheds might seem like a good idea until the electricity bill for the first month arrives. High brightness, tunable spectrum LED lights are expensive to run, particularly when lit 24×7. But light is not the only energy requirement. Many plants grow better when cosseted and in particular when the roots are kept warm. So not only does the plant growing space need to be expensively lit, it needs to be expensively heated as well.

Electricity-to-Lumens Conversion Does Not Mean Efficiency
When talking about LED efficiency lighting engineers always talk about conversion of electricity to lumens — with good reason because lights need to produce light! However, when you look at system efficiency, LED lights are 95+ percent efficient if you define the outputs as light and heat. Therein lies a stroke of genius. LED lights need to be cooled and the plants under the lights need their roots to be warmed, so why not use water to cool the LEDs and pump the warm water through pipes in the soil?

This approach has multiple advantages. Water is a much better cooling agent than air so manufacturers can make LED lights smaller, lighter, cheaper and more intense. The bits of the plant that need to be snuggly and warm are provided for and the requirements for insulating and air conditioning the growing space are greatly diminished. In one stroke, the system efficiency has leapt from unacceptable to brilliant. All the waste heat from the LEDs is recycled in the factory, rendering it eminently green.

With any new technology, the early adopters tend to be high-value products where the risk can be offset by the potential financial reward. Therefore, it’s likely to be a few years before you can buy a supermarket lettuce grown under LED lights. However, should you be partial to the occasional leaf of hippie lettuce, purely for medicinal purposes and only legal in certain jurisdictions, then the product will quite possibly have been grown under LED lights. Cool huh?

Categories Blog

Simple Test Reveals the Origin of Efficiency Droop

GaN-based LEDs find widespread applications, but they exhibit maximum efficiency only at very low current. The electrical-to-optical power conversion efficiency drops dramatically with higher input current. This so-called efficiency droop has been investigated for many years, and it still represents a key challenge to solid-state lighting, according to the DOE SSL R&D Plan published in May 2015. 

Trouble is, we often don’t know for sure what causes this efficiency droop. Different microscopic mechanisms have been proposed, most prominently thermionic electron leakage from the light-emitting active layers and Auger recombination inside these layers, respectively. Droop analysis is mainly based on modeling and very few direct measurements of either mechanism are published thus far.

The first direct evidence for Auger recombination in InGaN quantum wells was provided only two years ago by measuring high-energy (hot) electron emission from the LED surface (http://arxiv.org/abs/1304.5469). The authors believe that these hot electrons are generated by Auger recombination inside the active region and subsequently travel all the way to the LED surface. Another experiment was conducted independently by German researchers based on the assumption of a much shorter hot electron travel distance (http://epub.uni-regensburg.de/28841/2/ApplPhysLett_103_071108.pdf).  In that case, hot Auger electrons release their energy quickly and are captured by a neighboring active layer. However, the Auger signal is relatively weak in both cases and there is no direct evidence that the Auger process is strong enough to single-handedly cause the measured efficiency droop.

Electron leakage was first observed in 2008 on ultraviolet LEDs by measuring additional light emission from p-doped layers, which indicates electrons traveling beyond the active region. A few similar reports followed, but none was able to demonstrate a leakage magnitude that fully explains the measured efficiency droop. Interestingly, a group from Korea observed electron leakage when the LED is cooled down to cryogenic  temperatures (http://dx.doi.org/10.1063/1.3703313). The blue LEDs used in this study did not exhibit any leakage at room temperature. This result was quite unexpected since we usually believe that higher temperatures make it easier for electrons to escape from the active region.

Advanced computer simulation was recently able to explain this phenomenon (http://www.nusod.org/piprek/piprek15apl2.pdf). Due to the high ionization energy of Mg acceptors used for p-doping, rising temperatures free more holes and improve the hole conductivity significantly. This was confirmed experimentally by a group from Finland (http://dx.doi.org/10.1109/TED.2015.2391117). As a result, the hole injection into the active layers is enhanced, fewer electrons need to leak out to find holes, and the efficiency rises with higher temperature.

On the other hand, if Auger recombination is causing the droop, the simulations show a declining efficiency with higher temperature.  Thus, the competing efficiency droop mechanisms have the opposite effect on the efficiency when the LED temperature rises. The temperature sensitivity of the LED efficiency therefore offers a simple way to distinguish between both droop mechanisms. Published measurements commonly show a declining efficiency with higher temperature. Thus, Auger recombination can be considered the primary mechanism behind the efficiency droop in these devices.

In fact, I am not aware of any efficiency measurement that shows the opposite trend, i.e., a growing efficiency with rising temperature. Please send me an e-mail if you know of such a case (piprek@nusod.org).

Categories Product

Product Warranty and the LED Driver Topology Choice

Does the choice of the LED driver affect Product Warranty? The driver is the electronics used to convert the AC input voltage to the DC voltage used by the LEDs and while there is no substitute for testing the actual driver failure rate in the application environment, there is a method to predict the driver topology choice impact between three versus five even up to 10-year warranties. Mean Time to Failure (MTTF) will be the method to analyze the reliability of a non-repairable device like an A19 bulb which is discarded upon failure. Knowing the MTTF helps a manufacturer decide a warranty period. The MTTF number calculated or measured along with the customer usage of the LED light per year factors into the warranty period. A failure defined in this blog is when the driver has stopped working. The other components in the LED light, optics, LEDs, connectors, wires, etc., are not considered, but play just as important role in the warranty calculation. A failure could include color shift or lumen depreciation, but is not accounted for in this blog.

There are several methods used to predict MTTF and one starting method is the summed failure rate. It calculates the failure rate of the driver as the sum of the failure rates of its components. This summed failure rate is then inverted to give the product’s MTBF or MTTF and is originally based on MIL-HDBK-217F. The method of choice for LED drivers reliability prediction is Siemens SN29500. This approach uses summed failure rates. The based failure rates are based on much newer data than those found in MIL-HDBK-271F.


Figure 1. Primary-Side Regulated LED Driver with Power Factor Correction

A common LED driver used in replacement bulbs is the primary side regulated (PSR) flyback topology with power factor correction. A typical example driver is the FL7733A as shown in Figure 1.

The advantage of this PSR topology is it provides isolation for the lowest BOM and does not require a secondary feedback loop to regulate the output current in the LED string – it eliminates the use of an opto-isolater, reference, additional resistors and capacitors which contribute to the failure rate of the led driver. The PSR technique can achieve constant current accuracy <±3 percent.  PSR controllers also include power factor (PF) correction achieving >0.9 PF and <10 percent Total Harmonic Distortion over universal operating input voltages from 90 VAC to 277 VAC. Including PF correction also eliminates components needed for products that need a PF >0.9. Integrating the start-up circuit also reduces component count leading to a lower failure rate.

Now let’s consider the total number of expected failures for a PSR flyback led driver over a three year warranty. A FIT rate of 227.1 has been calculated for a PSR flyback topology.[1]  Assume the manufacturer will sell 100,000 led bulbs.

Assume 100 hours POH/month. In one month,

# of fails = # of units x failure rate x hours/mn
=100,000 x 0.0000002271 x 100
=2.271 fails/mn

In three years,

# of fails = 36 months x 2.271 fails/mn
= 81.76 fails

The predicted number of failures out of the total sold of 100,000 led bulbs in three years is 82 bulbs. For five years the estimated failed bulbs is 136, still a low number of failures so extending the warranty period to 10 years would predict 272 failed bulbs as potential replacement costs. Life testing should be done to correlate the results.

The LED driver topology does have a factor in the success of a warranty period. The key is to select a topology that has the lowest BOM count will still resulting in the performance targets of the LED bulb.

A comment on testing for MTTF, in theory the total operating time for a driver population must be known to calculate an MTTF. But, this is an unrealistic expectation since the warranty has to be set before all products have been accounted for so life testing is used to estimate MTTF. A life test in which 20 or more units are run to accumulate total operating time can take a long while.[2]